Minitab PC Software gives quality engineers, data analysts, researchers, and Six Sigma practitioners a dedicated statistical processing environment to analyze datasets, evaluate manufacturing quality, and build predictive models. Working with large sets of measurement data in standard spreadsheet applications often leads to manual formula errors, cumbersome charting workflows, and limited statistical testing options. By combining comprehensive statistical methods with automated menu-driven assistants, dynamic visual graphs, and predictive machine learning algorithms, this analytical suite provides organizations with the tools required to make data-driven decisions and improve operational processes.
Overview
Minitab PC Software is an industry-standard statistical and data analysis application developed by Minitab, LLC. Initially created in 1972 at the Pennsylvania State University as a educational tool for teaching statistics, it has evolved into a comprehensive commercial analytics package utilized heavily in manufacturing, healthcare, pharmaceuticals, academic research, and business process improvement.
Minitab, LLC actively maintains the platform across its modern version 21 release series, offering both a native 64-bit Windows desktop application and a web cloud version accessible through modern web browsers. The software operates under commercial subscription licensing tiers tailored for individual professionals, educational institutions, and enterprise sites. It targets quality control managers, Process Improvement Specialists (Six Sigma Green and Black Belts), industrial engineers, academic researchers, and operational managers who require rigorous statistical validation without writing complex code.
Your May Also Like :: GoodSync PC Software - File4PC
Key Features
The software incorporates a wide array of statistical testing modules, quality engineering tools, and data visualization features tailored for industrial and analytical workflows.
Comprehensive Statistical Analysis Suite
The core calculation engine covers fundamental and advanced statistical methodologies. Users can run descriptive statistics, hypothesis testing (such as t-tests, ANOVA, and chi-square tests), regression analysis, time series forecasting, and multivariate analysis. The output is displayed in a structured Session Window alongside clear p-values and confidence intervals.
Quality Tools and Statistical Process Control (SPC)
Built specifically for quality assurance and manufacturing control, the suite includes dedicated tools for Statistical Process Control. Engineers can construct Pareto charts, cause-and-effect (fishbone) diagrams, control charts (Xbar-R, I-MR), capability analysis plots (Cp, Cpk), and Measurement System Analysis (MSA) studies like Gage R&R to evaluate process stability and measurement accuracy.
Design of Experiments (DOE)
Optimizing complex processes requires understanding how multiple variables interact. The Design of Experiments module enables users to construct, evaluate, and analyze factorial, fractional factorial, response surface, mixture, and Taguchi designs. This allows research teams to identify critical process variables and optimize product formulations efficiently.
Interactive Assistant Menu
To guide non-statisticians through complex analytical choices, the built-in Assistant feature acts as an interactive guide. It helps users select the correct statistical test based on their data type, checks necessary mathematical assumptions before running the analysis, and provides easy-to-read visual reports with plain-language interpretations of the results.
Predictive Analytics and Machine Learning
Modern releases expand beyond classical statistics into predictive analytics. Integrated machine learning algorithms—such as Classification and Regression Trees (CART), Random Forests, and Gradient Boosting trees—allow analysts to discover deeper patterns, model complex non-linear relationships, and generate accurate forecasts from structured business datasets.
How Minitab PC Software Works
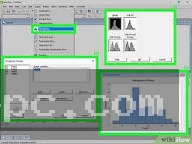
The application uses an intuitive interface split into three primary working areas: the Data Window (spreadsheet layout), the Session Window (text output and calculation results), and the Graph Window.
First, you load your data into the worksheet by typing values directly, copying rows from external spreadsheets, or importing files formatted as XLSX, CSV, or database tables.
Second, navigate to the top menu bar to select your required analytical task, such as Quality Tools, Stat, Graph, or Assistant. Choose the specific analysis (for example, Stat > Basic Statistics > 1-Sample t) and select the worksheet columns corresponding to your variables inside the dialog box.
Third, click OK to execute the calculations. The software generates numerical outputs, statistical significance values, and summary tables in the Session Window while opening interactive visual plots in separate graph windows. You can customize visual elements, export high-resolution charts, or send reports directly to Microsoft Word or PowerPoint.
When performing complex statistical tests, always check data distribution assumptions before drawing conclusions. Running parametric tests on non-normal data without appropriate transformations can produce misleading statistical conclusions.
Benefits and Limitations
Evaluating the application's core operational strengths against its system constraints helps determine how it fits into an organizational analytics strategy.
Benefits
-
User-Friendly Interface: The menu-driven interface allows engineers and analysts to execute complex statistical procedures without writing programming code.
-
Dedicated Quality Control Framework: Offers built-in Gage R&R, Cpk capability analysis, and control charting tailored directly to industrial quality standards.
-
Interactive Assistant: The built-in Assistant helps users choose appropriate tests and explains statistical outputs in plain language.
-
Seamless Office Integration: Visual graphs and summary tables export easily into presentation decks and documentation reports.
Limitations
-
Commercial Subscription Cost: Pricing represents a significant recurring investment compared to free open-source programming alternatives.
-
Limited Custom Scripting Flexibility: While macro automation is supported, it lacks the endless customization and package ecosystems found in programming languages like R or Python.
-
Focus on Structured Data: Engineered primarily for structured tabular datasets rather than unstructured text mining or raw big-data streaming pipelines.
What's New
Minitab, LLC maintains a continuous deployment model across its version 21 release branch, adding new features through regular system updates.
Recent major enhancements focus on expanding predictive analytics capabilities, cloud integration, and automated reporting. Key additions include integrated CART classification models, automated tree-building algorithms for decision analysis, seamless cloud folder synchronization between desktop and web app instances, improved graphical customization tools, and enhanced export options for automated presentation building.
Installation and Setup
Acquire the setup package directly through official Minitab, LLC enterprise distribution channels or your institutional license portal. Ensure your Windows environment meets baseline system requirements, including a 64-bit operating system and required .NET Framework runtimes.
Run the installer setup file with administrative privileges. Select your installation path, accept the software licensing terms, and select your licensing model (named user subscription or concurrent network license manager).
Launch the software upon installation completion. Sign in with your registered account credentials or specify your network license server address to authenticate the application and start your working session.
Tips for Using Minitab PC Software
-
Leverage the Assistant Menu: Use the Assistant menu when unsure which test applies to your data type to avoid picking mismatched statistical procedures.
-
Save Work as Projects (.MPJ): Save your work as a complete Project file (.MPJ) rather than just a worksheet (.MTW) to store your data, session logs, history, and generated graphs together in one file.
-
Use Graph Brushing for Outliers: Use the "Brush" tool on scatter plots and control charts to highlight specific data points and inspect their corresponding row values inside the worksheet instantly.
-
Automate Repetitive Tasks with Executables (.EXEB): Save sequences of routine commands as executable macro files to automate weekly quality control reporting workflows.
Modern Alternatives
-
JMP: A powerful visual statistical discovery software package developed by SAS, widely used for interactive graphical data exploration and advanced Design of Experiments.
-
R (with RStudio): A free, open-source programming language and environment dedicated to statistical computing, offering thousands of community-developed packages for data modeling.
-
IBM SPSS Statistics: A widely used commercial statistical package favored in social sciences, market research, and healthcare for complex survey analysis and predictive modeling.
Who Should Use Minitab PC Software?
This software is an ideal choice for quality control engineers, Six Sigma practitioners, process engineers, academic researchers, and operations managers who need a reliable, menu-driven platform for rigorous data analysis. Its specialized tools for process capability, control charting, and DOE make it particularly valuable in manufacturing, healthcare administration, and pharmaceutical production.
Data scientists or software engineers who prefer code-based workflows, neural networks, or massive unstructured big-data pipelines may find open-source environments like Python or R more suited to their workflow.
FAQ
Is Minitab PC Software available for 32-bit Windows systems?
No. Modern versions of the software require a 64-bit operating system architecture to handle large datasets and modern memory management.
Can I access my projects on a Mac or Chromebook?
Yes. While the desktop application is native to Windows, active subscribers can log into the web version using any modern web browser on macOS, Linux, or ChromeOS.
What file formats can the software import?
It natively imports Minitab Worksheet (.MTW) and Project (.MPJ) files, Microsoft Excel (.XLSX, .XLS), text files (.TXT, .CSV), and data from database connections via ODBC drivers.
Does the software require an active internet connection?
A internet connection is required for initial sign-in, subscription license verification, and accessing web cloud storage. Desktop installations can operate offline for defined grace periods once authenticated.
What is the difference between a Worksheet file and a Project file?
A Worksheet file (.MTW) contains only raw data columns, whereas a Project file (.MPJ) saves all worksheets, session window text outputs, generated graphs, command history, and custom layout settings in a single file.
Conclusion
Making informed operational decisions requires turning raw measurement data into clear, statistically sound insights. Minitab PC Software provides an efficient platform for this process by combining comprehensive analytical tests, specialized quality tools, and an interactive Assistant within an accessible interface.
While adopting the platform involves a commercial subscription investment, the gains in analysis speed, defect reduction, and reporting clarity are substantial for quality-driven organizations. Utilizing its Design of Experiments and Statistical Process Control modules helps ensure your operations maintain high quality, consistency, and process efficiency.


💬 0 Comments
✍ Leave a Comment